Q3 Report
Q3 2025 Manhattan & Brooklyn Real Estate Market Report
NYC real estate is illiquid even relative to the rest of the country. Our average days-on-market is 75% longer and length of time from contract-signing to closing is considerably longer as well. Therefore, quarterly market reports tend to feature trailing data: homes that sold last quarter went into contract the quarter before, and therefore stats on closings tend to be more indicative of market activity six months prior rather than the previous quarter. Q2’s closing data was strong, seemingly unaffected by April’s ‘Liberation Day’ and subsequent tariff-policy instability. However, experts (including myself) cautioned at the time that Q2’s closings were Q1’s signed contracts, and the effect of US government tariff policy therefore wasn’t reflected in the second quarter’s strong figures. While the NYC real estate market seemed to escape the tariffs’ drag in Q2, we’d see their full effect in the Q3 figures. Those figures are now in, and we see the damage: All closing price metrics rose year-over-year for the third quarter in a row, the longest such streak since 2022. Sales activity rose 5% year-over and was even with Q2. Available inventory held steady with Q3 2024 and contracted 11% from this years’ second quarter.
How did we get away with strong figures in the face of economic and political uncertainty? Dividing market sectors above and below $3m tells the story: sales activity below $3m rose just 2% year-over, while sales above $3m rose a striking 20%. While luxury price metrics didn’t necessarily rise, the sector’s increased share of the entire market pushed all market-wide metrics higher.
Why such a dramatic increase in sales activity in the luxury sector? Luxury homes aren’t necessarily showing more value; pricing has held steady from Q3 2024. The difference is, while these buyers see the same uncertainty across the economy, they perceive it as a buying opportunity, and focus on safe-haven investments like Manhattan real estate. Additionally, an inventory shortage in luxury Manhattan new development has begun, and will likely last years given the slow nature of the new development pipeline. Luxury buyers are rushing to buy into a market with shrinking supply. This has also become a largely all-cash market, serving as a bulwark against rising rates that more seriously affect demand at the lower end.
Luxury buyers also feel Federal tax policy winds at their back: The drastic tax cuts of the 2017 Tax Cuts and Jobs Act have recently been made permanent by the so-called One Big Beautiful Bill, cuts that make the City-tax increases proposed by the current mayoral front-runner appear menial by comparison. This frees up capital to invest, in an environment that appears to offer few solid investments… further explaining flight to the stability of NYC real estate. These buyers are also likely reading-in-between-the-lines of foreboding economic headlines and seeing a market showing more stability than those headlines would suggest: the yield curve has become less inverted and the S&P 500 is up 15% over the past twelve months, and core CPI is at 3.1% in an environment where interest rates are expected to decrease due at least in part to political pressure rather than Fed concern over economic growth. While our market shows unmistakable signs of uncertainty, that uncertainty is not the result of macro-economic cycles, but of self-inflicted setbacksthat the market has, thus far, judged as temporary. For Manhattan buyers, this signals an opportunity to adhere to Warren Buffet’s maxim “Be fearful when others are greedy, and greedy when others are fearful.”
Manhattan Sales Market
Click the icon below to view the Q3 2025 Elliman Report for Manhattan sales:
- Median sales price rose 3% market-wide year-over and 6% from last quarter to $1.325m.
- Q3 saw more listings pulled from the market than added in the face of early-April tariff uncertainty, for a net-decrease in total inventory.
Brooklyn Market Sales
Click the icon below
to view the Q3 2025 Elliman Report for Brooklyn sales:
- Sales activity declined 5.2% year-over-year, reflecting slight buyer hesitation despite strong fundamentals.
- Inventory levels increased by 12.8%, providing more options for prospective buyers.
My Newest Listing: 417 Riverside Dr 5F
Bright studio with high ceilings and eat-in kitchen in full-service Morningside Heights coop!
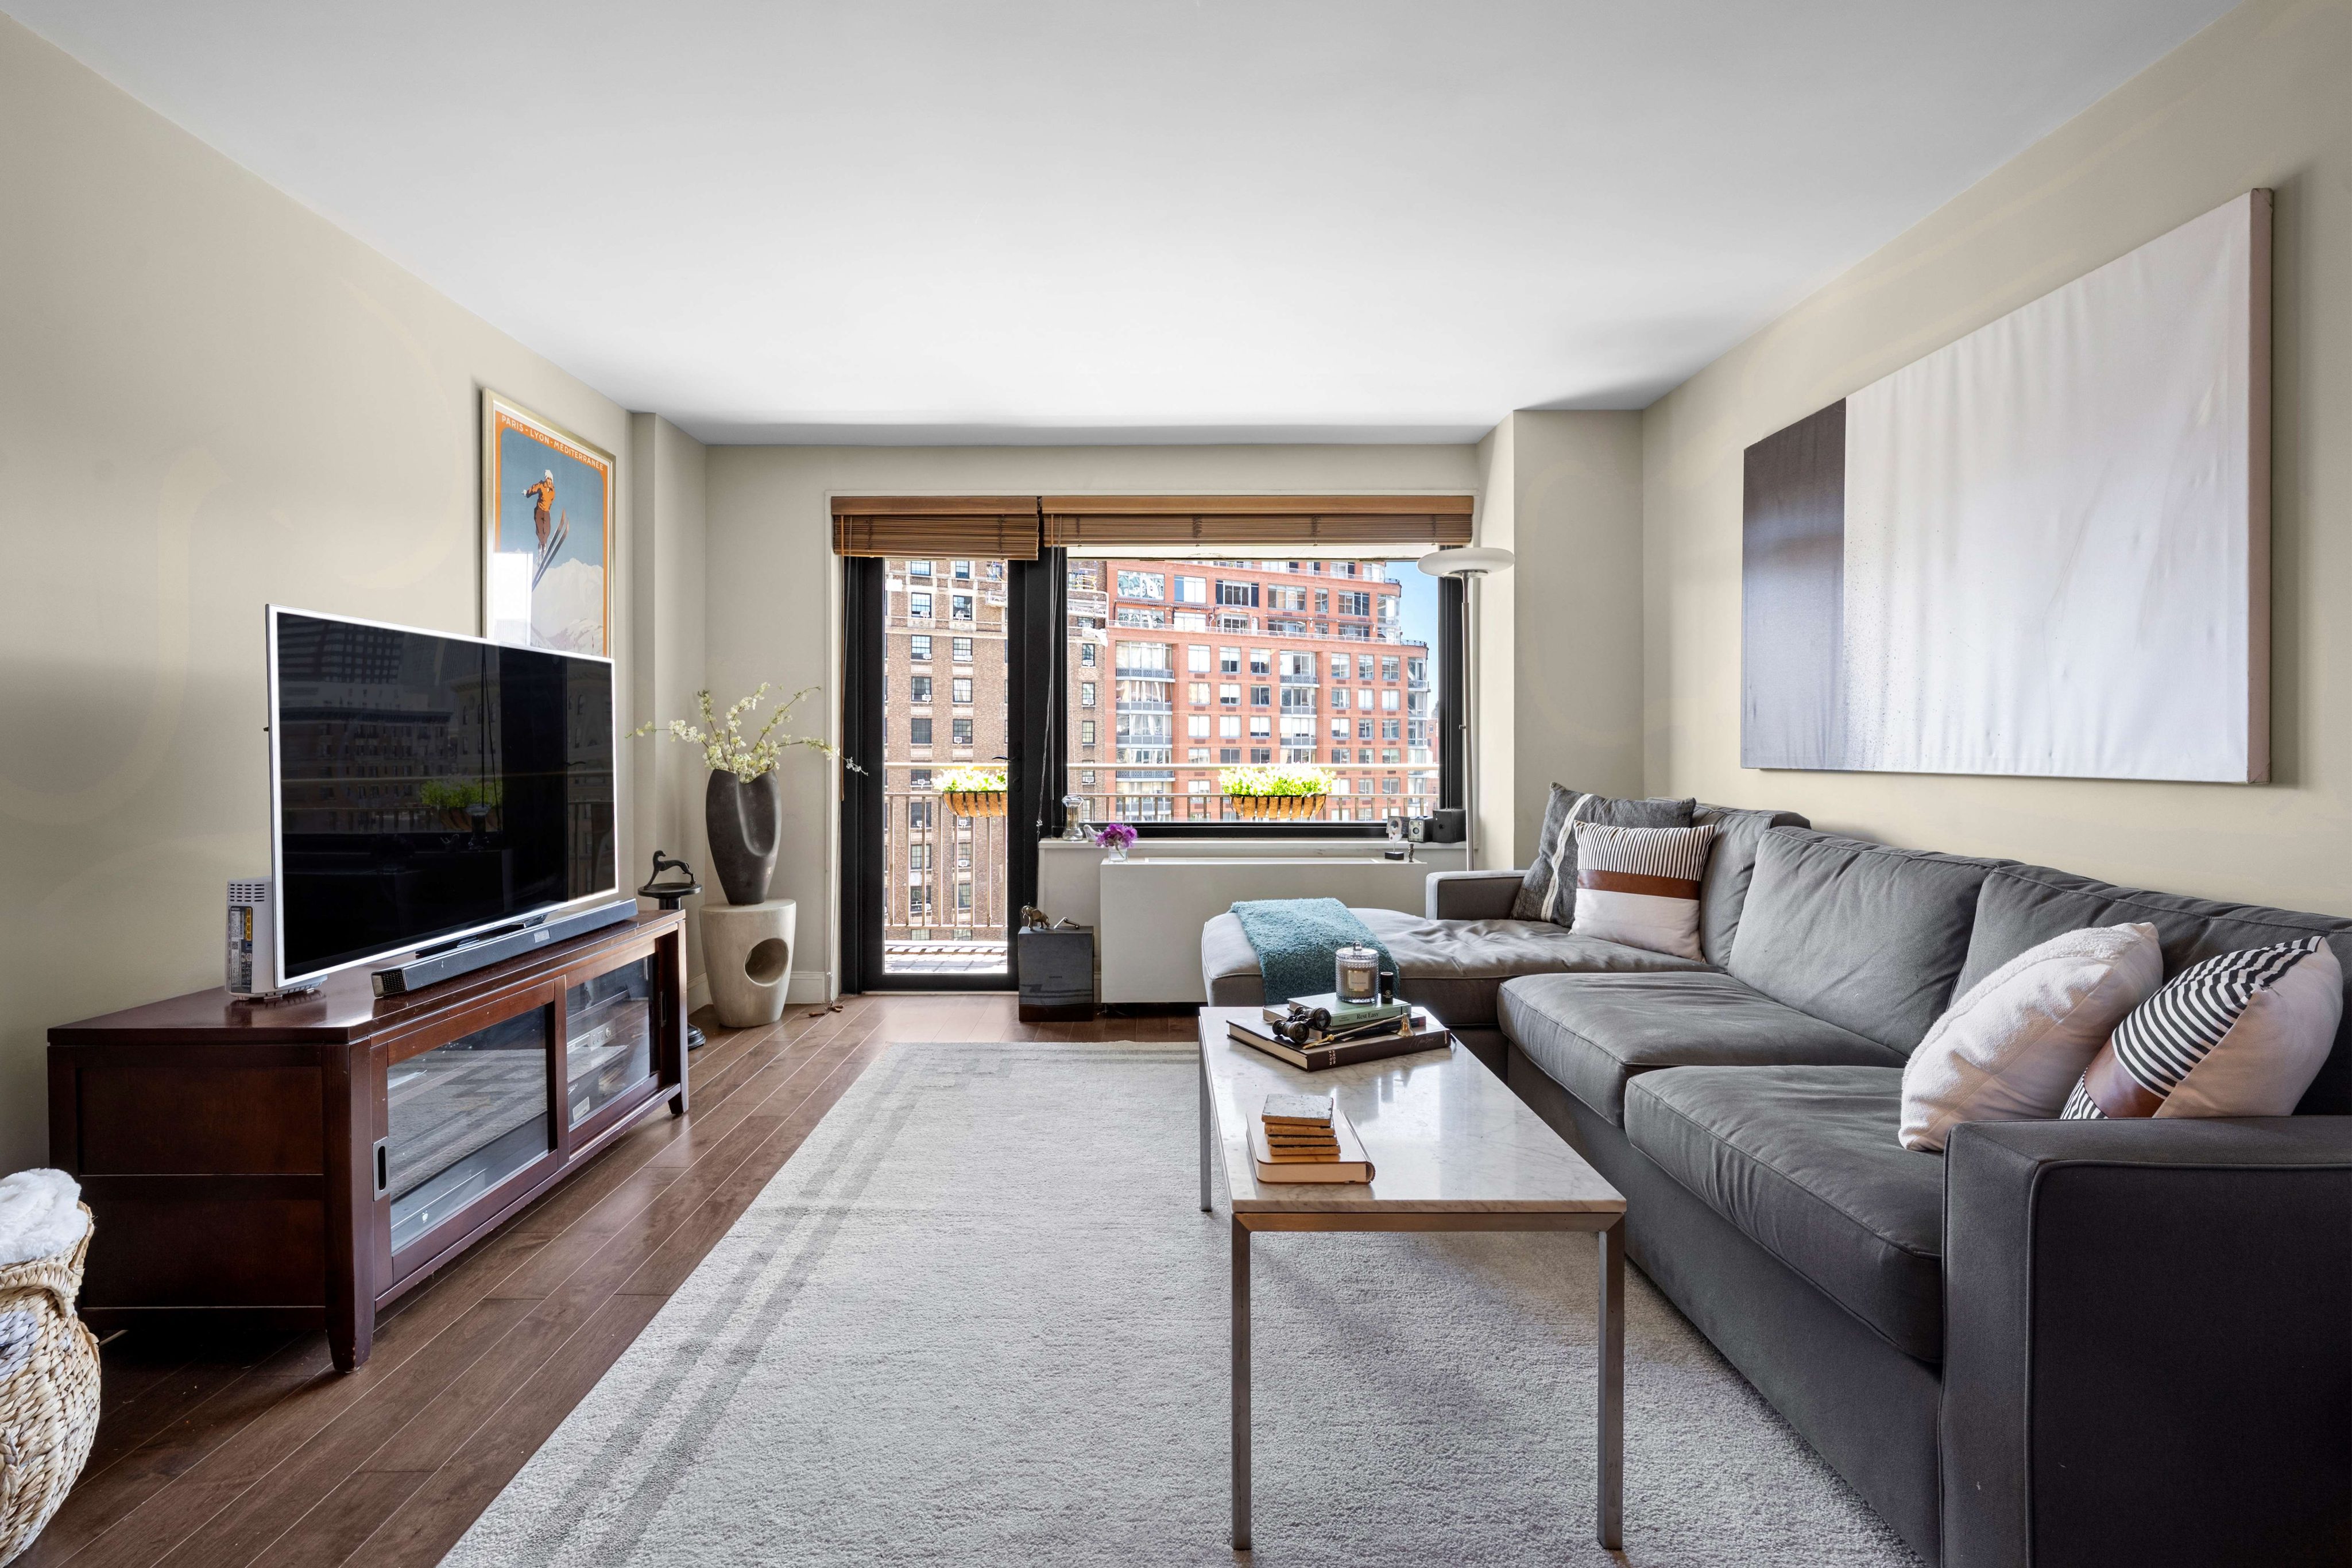
Quickly In-Contract: 285 Riverside Dr 11G
Beautifully redesigned classic-6 with cityscape views on Riverside Dr!
My hottest listing: 211 West 10th St 2A
This West Village 1 bed accepted one of multiple offers after only a few days on-market!
Just Sold: 201 West 70th St 15G
I’m thrilled for this seller, who upgraded to a 5-room pre-war from this 1 bed he’d called home for over 20 years.
Presenting a new way to search for Real Estate
jacobwoodre.com pulls listings using the same IDX feed as all major brokerages and real estate sites. Since StreetEasy forces agents to manually upload their listings in order to charge them per-listing, many agents don’t put all of their listings on StreetEasy, or keep them up-to-date. The home search function on my website offers all of those listings.
Check out this article next

What to Do After You’re In Contract
Let’s discuss what to do once your home is in contract to prep for a seamless closing.As a seller, once we’re in contract, there’s not…
Read Article


